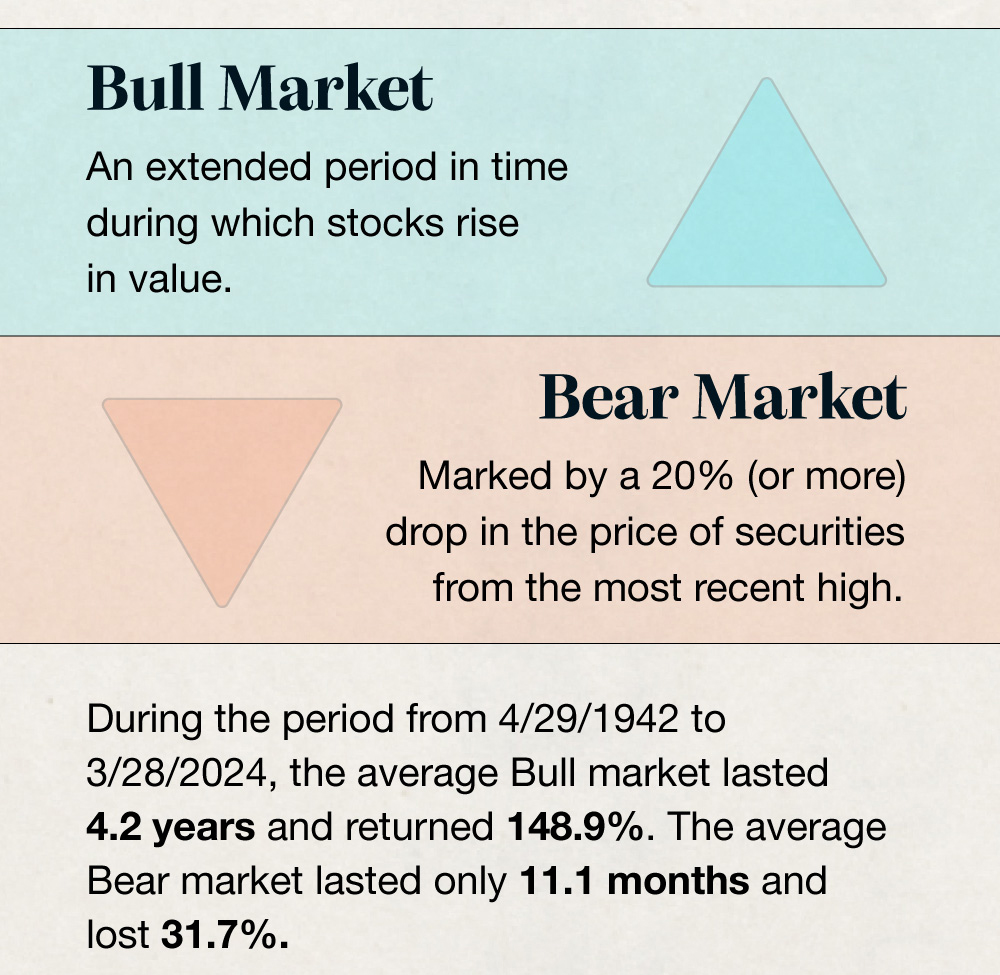
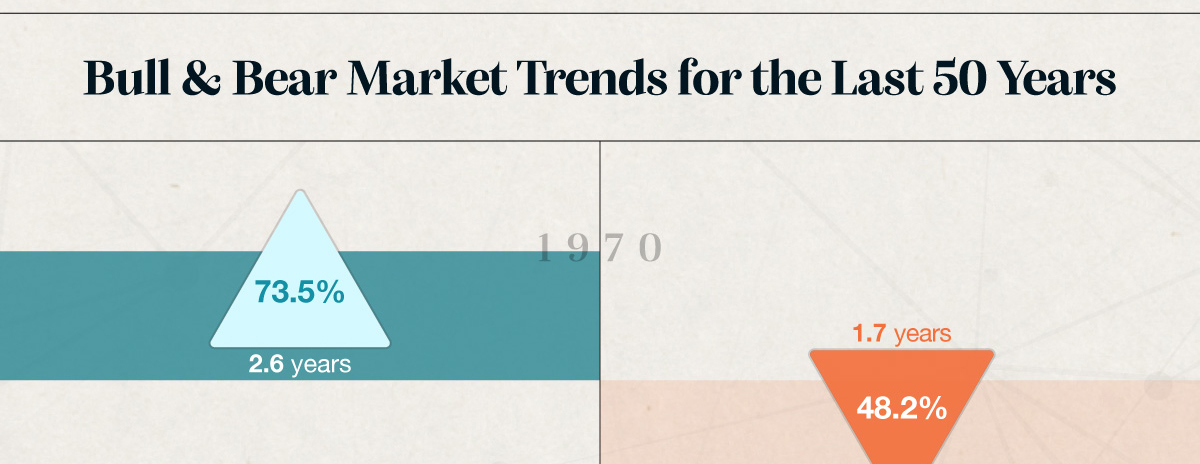
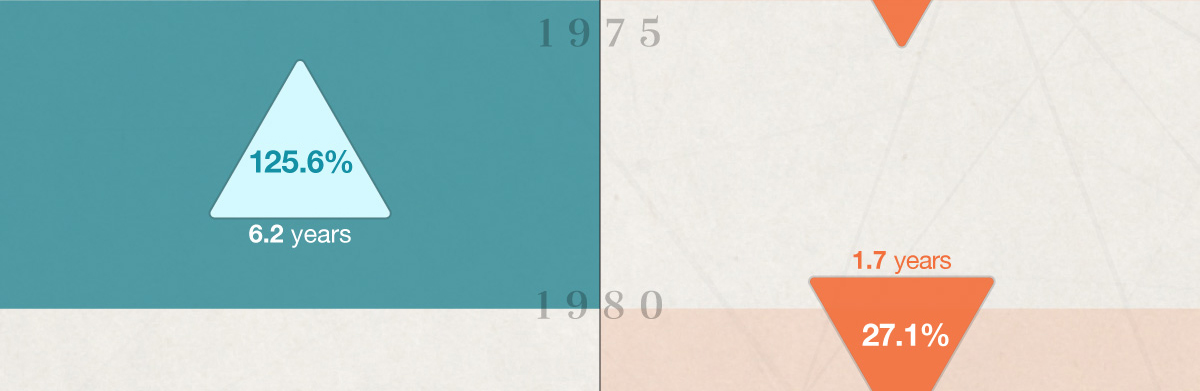
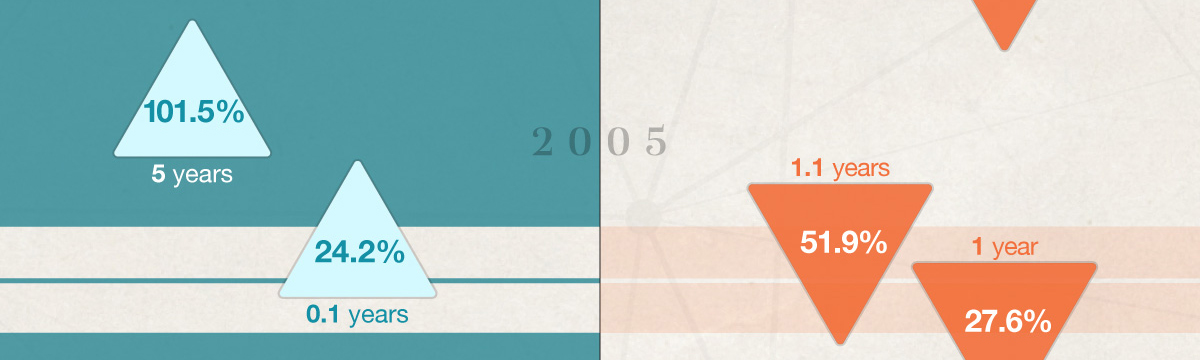
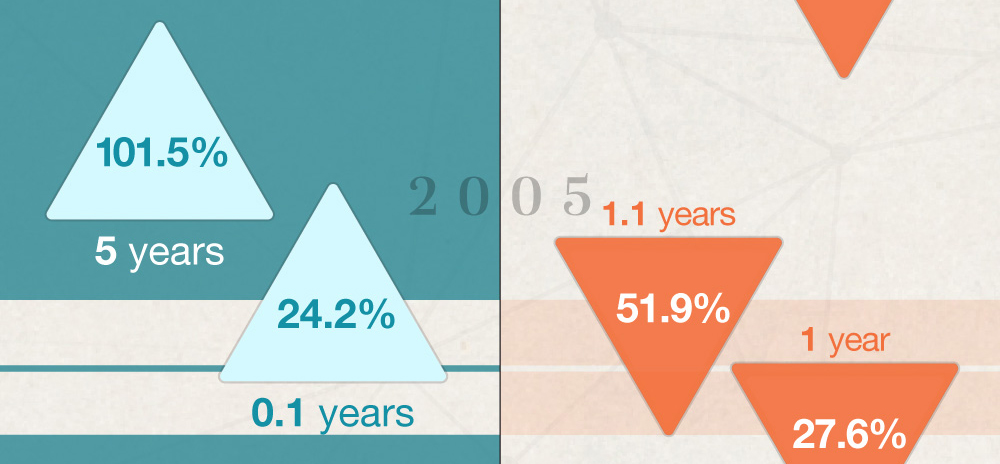
Bull & Bear Markets: A Timeline


A visit to the hospital can be painful, for both your body and your wallet. Don't let it be more painful than it has to be.

Here are six flags that may make your tax return prime for an IRS audit.

Looking forward to retirement? It's critical to understand the difference between immediate and deferred annuities.